Trade-offs, Integration, and Governance
Slides — Chapter 8
Today’s roadmap
2-hour-20-minute session, the course wrap-up. Five parts, six discussion breaks
| Time | Part |
|---|---|
| 0:00 – 0:20 | Review: what we’ve covered |
| 0:20 – 0:45 | The key trade-offs |
| 0:45 – 0:55 | Break |
| 0:55 – 1:45 | An integrated framework: the lifecycle, plus a capstone exercise |
| 1:45 – 2:10 | Practical governance |
| 2:10 – 2:20 | Course summary |
Learning objectives
- Summarise and connect the methods across Chapters 2–7
- Identify and analyse trade-offs among fairness, explainability, privacy
- Apply the ethical AI lifecycle as an integrating framework
- Design a governance and documentation workflow
- Critically evaluate an AI system against the six principles
Part 1 — Review
Three pillars, six chapters
| Ch | Pillar | Key methods |
|---|---|---|
| 2–3 | Fairness | Criteria (FTU, CPV, DP, CDP…); five model designs; fairness–accuracy trade-off; COMPAS (US recidivism tool) |
| 4–5 | Explainability | PFI, PDP, ALE, SHAP, LIME; global + local; interactions |
| 6–7 | Privacy | Re-identification risk, k-anonymity, differential privacy, synthetic data |
No chapter is self-contained. A real system must address all six ethics principles simultaneously. Managing the interactions is this chapter.
Case Study: credit-based insurance scores
The limits of actuarial fairness
- Since the early 1990s, US car insurers have priced policies partly on credit-based insurance scores, a textbook case of actuarial fairness: charge people by their true expected cost
- The scores are genuinely predictive. The practice still triggered sustained regulatory pushback: investigations in 17+ states, 5 congressional hearings, dozens of restricting state laws (Kiviat 2019)
- Regulators’ objection: prediction alone doesn’t settle who deserves to pay more. They demanded to know why scores predicted claims, not just that they did
- Most states now require insurers to disregard specific negative credit events tied to documented hardship: divorce, job loss, a medical emergency (“extraordinary life circumstances” exemptions)
- A 2007 FTC report found over 25% of Black consumers fell in the lowest score decile vs. 3% of white consumers. Scores still predicted claims within each group, satisfying actuarial fairness on its own terms
- Outcome: 4 US states ban the practice outright. Every other state instead imposes constraints (disclosure, exemptions, restricted factors) while still permitting it
A criterion can be statistically valid and satisfy a named fairness definition, and still be rejected as illegitimate. Which criterion should govern a practice is a contested, political determination, not a purely quantitative one.
Revisiting the motivating problem
Chapter 1: the insurer that removed gender
Engine size and annual mileage remained. Both correlated with gender. Has the insurer achieved fairness?
Now you can answer more rigorously:
- Ch. 2: FTU-fair, maybe. DP- or CDP-fair, probably not.
- Ch. 3: Fit MCDP or MC. Audit with a pre-committed TOST (shows compliance, not just failure to detect a violation).
- Ch. 4–5: Use SHAP to find what’s driving the residual disparity, and check for interactions.
- Ch. 6–7: Assess re-identification risk in the data. Consider whether differential privacy or synthetic data belongs in the pipeline.
💬 Discuss (4 min)
Using everything from Chapters 2–7 —
a. How would you now answer “has the insurer achieved fairness”? What’s still missing, even with all these tools?
b. Taking insurance as an example: how would you decide whether a variable like engine size or annual mileage should be used for pricing at all, versus excluded outright, even though each has a genuine, non-discriminatory reason to correlate with risk? What changes when the variable is external or non-traditional, telematics, social media activity, or credit history, rather than a variable the insurer collected for its own actuarial purpose?
Part 2 — The key trade-offs
Three fundamental tensions
1. Fairness vs. accuracy. A fairness constraint reduces usable predictive information
2. Explainability vs. performance. Simpler models are easier to explain but generally less accurate, and post-hoc tools add computation and approximation error
3. Privacy vs. utility. k-anonymity, differential privacy, and synthetic data all reduce information content
Each pillar creates obligations that can conflict with the others.
The fairness–accuracy trade-off
| Model | Accuracy | Disparity |
|---|---|---|
| M0 | Highest | Highest |
| MU | Moderate reduction | Moderate reduction |
| MCDP / MC | Small reduction | Large reduction |
| MDP | Largest reduction | Near zero |
Accuracy measured by RMSE (smaller error = higher accuracy); “reduction” describes the drop from M0’s accuracy level as fairness constraints tighten.
Not always a trade-off. When errors are unevenly distributed across groups to begin with, a fairness-aware model can sometimes reduce disparity and improve accuracy at once — a genuine win-win (Huang et al. 2024).
A policy decision, not a modelling decision
No statistically correct level of constraint. Depends on regulatory regime, product type, stakeholder values, market structure. Practitioners quantify the trade-off. Decision-makers choose it.
The privacy–utility trade-off
| Technique | Guarantee | Utility cost |
|---|---|---|
| k-Anonymity | None formal | Reduced precision, some suppression |
| Differential privacy (ε=1) | Strong | High noise |
| DP (ε=10) | Weak | Low noise |
| Synthetic (no DP) | None | High fidelity, memorisation risk |
Techniques are layered in practice: k-anonymise → synthesise → check NNDR (nearest-neighbour distance ratio) → DP on released summary stats. Defence-in-depth, not one silver bullet.
Explainability ↔︎ fairness
Revealing: a SHAP beeswarm showing Postcode dominating premium variation (premium being the price a customer pays for their policy) can flag proxy discrimination the fairness model missed.
Masking: SHAP and LIME can be adversarially manipulated (Slack et al. 2020). A model can look innocuous to an auditor while still discriminating in production.
Explanation tools generate hypotheses and guide criterion choice. They don’t replace formal fairness testing.
💬 Discuss (4 min)
If explanation tools can be gamed to look fair —
what would actually make you trust a vendor’s fairness claims?
Break — 10 min
Part 3 — An integrated framework
The ethical AI lifecycle, revisited
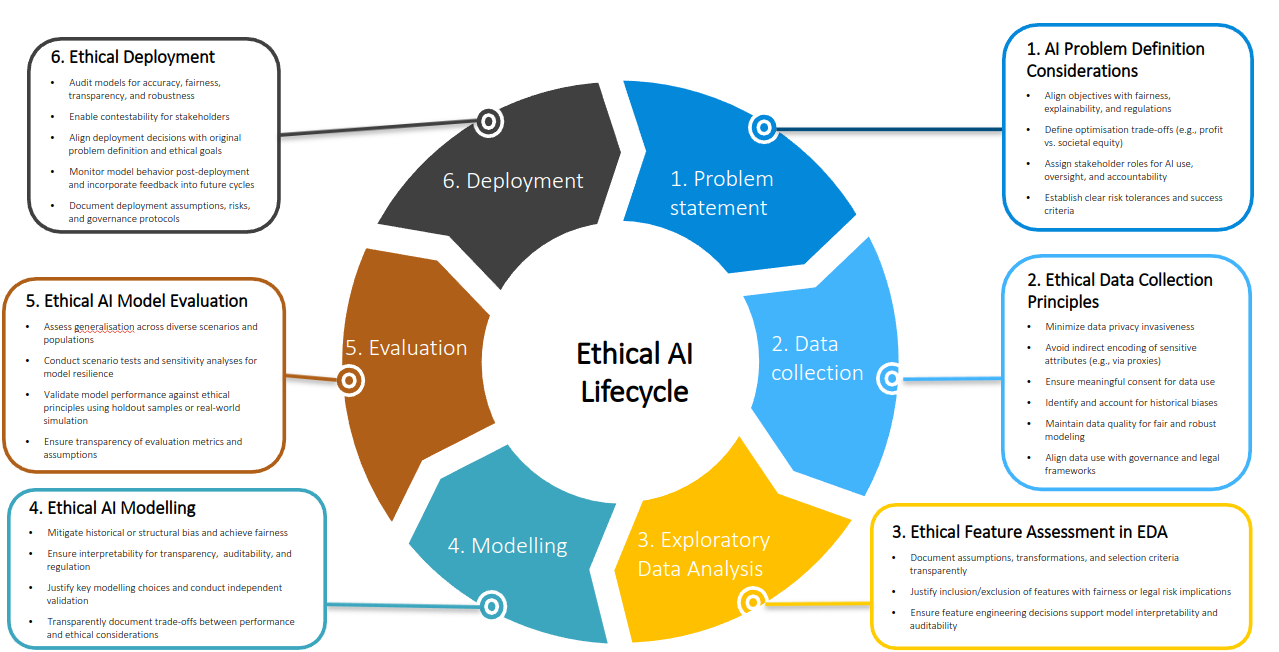
The ethical AI lifecycle. Source: Huang (2025).
Now we populate each stage with concrete responsible AI obligations.
Stages 1–3
1. Problem definition. Is AI appropriate? Which criterion applies? Who’s accountable?
2. Data collection. Legal basis? Historical bias? Quasi-identifiers? Minimisation?
3. Model development. Right model design? Proxies addressed? Explainable enough? Trade-off quantified?
A wrong choice at Stage 1 can’t be fixed by better modelling later.
Stages 4–6
4. Validation. Pre-committed audit? TOST, not plain significance? Stable out-of-time?
5. Deployment. Human review for edge cases? Contestability? DPIA (data protection impact assessment) complete?
6. Monitoring. Fairness metrics recalculated? Data drift tracked? Retraining trigger?
💬 Discuss (4 min)
Of the six lifecycle stages —
which do you think most AI failures actually originate in, even though they surface much later?
Capstone case study: claims triage
A motor insurer builds an AI claims-triage system: every incoming claim gets a fraud-risk and complexity score. Low scores → fast-tracked payout within 48h. High scores → routed to manual investigation before any payment.
- Fairness: if the score correlates with postcode or vehicle type, are the claimants least able to absorb a delay also the most likely to face one?
- Explainability: does a claimant whose payment is delayed know why, and can they appeal?
- Privacy: the model needs claim narrative text, injury detail, third-party records, exactly what a data-sharing agreement needs to protect.
🧩 Exercise (15 min) — work the lifecycle
For each stage, answer using the chapter’s own tools, not general reasoning.
| Stage | Applied question | Ch |
|---|---|---|
| 1. Problem definition | Cost of a false positive vs. a false negative, and who bears each? Reversible? | 1 |
| 2. Data collection | Historical bias in claim-history data? Narrative text minimised? | 6 |
| 3. Model development | Which fairness criterion? Which design keeps the fraud signal? | 2, 3 |
| 4. Validation | What audit protocol proves, not just fails to disprove, fairness? | 2, 3 |
| 5. Deployment | A specific explanation and a real appeal, or a generic notice? | 4, 5 |
| 6. Monitoring | What triggers re-validation after a fraud-pattern shift? | 3, 6 |
🧩 Exercise, continued — the trade-offs
Step back from the stage-by-stage view:
- Does a stricter fraud model (fewer real frauds paid, more genuine claims delayed) justify itself? Who decides, on what evidence?
- Does minimising claim data for privacy remove exactly the detail the fraud model needs? Is there a Ch 6/7 technique that reduces this cost instead of just accepting it?
- More accurate but less explainable, or less accurate but more transparent, given the explanation is owed to one claimant, not just a regulator?
There is no answer key. You should leave with a defensible position on each question, and an honest account of which trade-offs you resolved versus only acknowledged.
Regulations → criteria → models
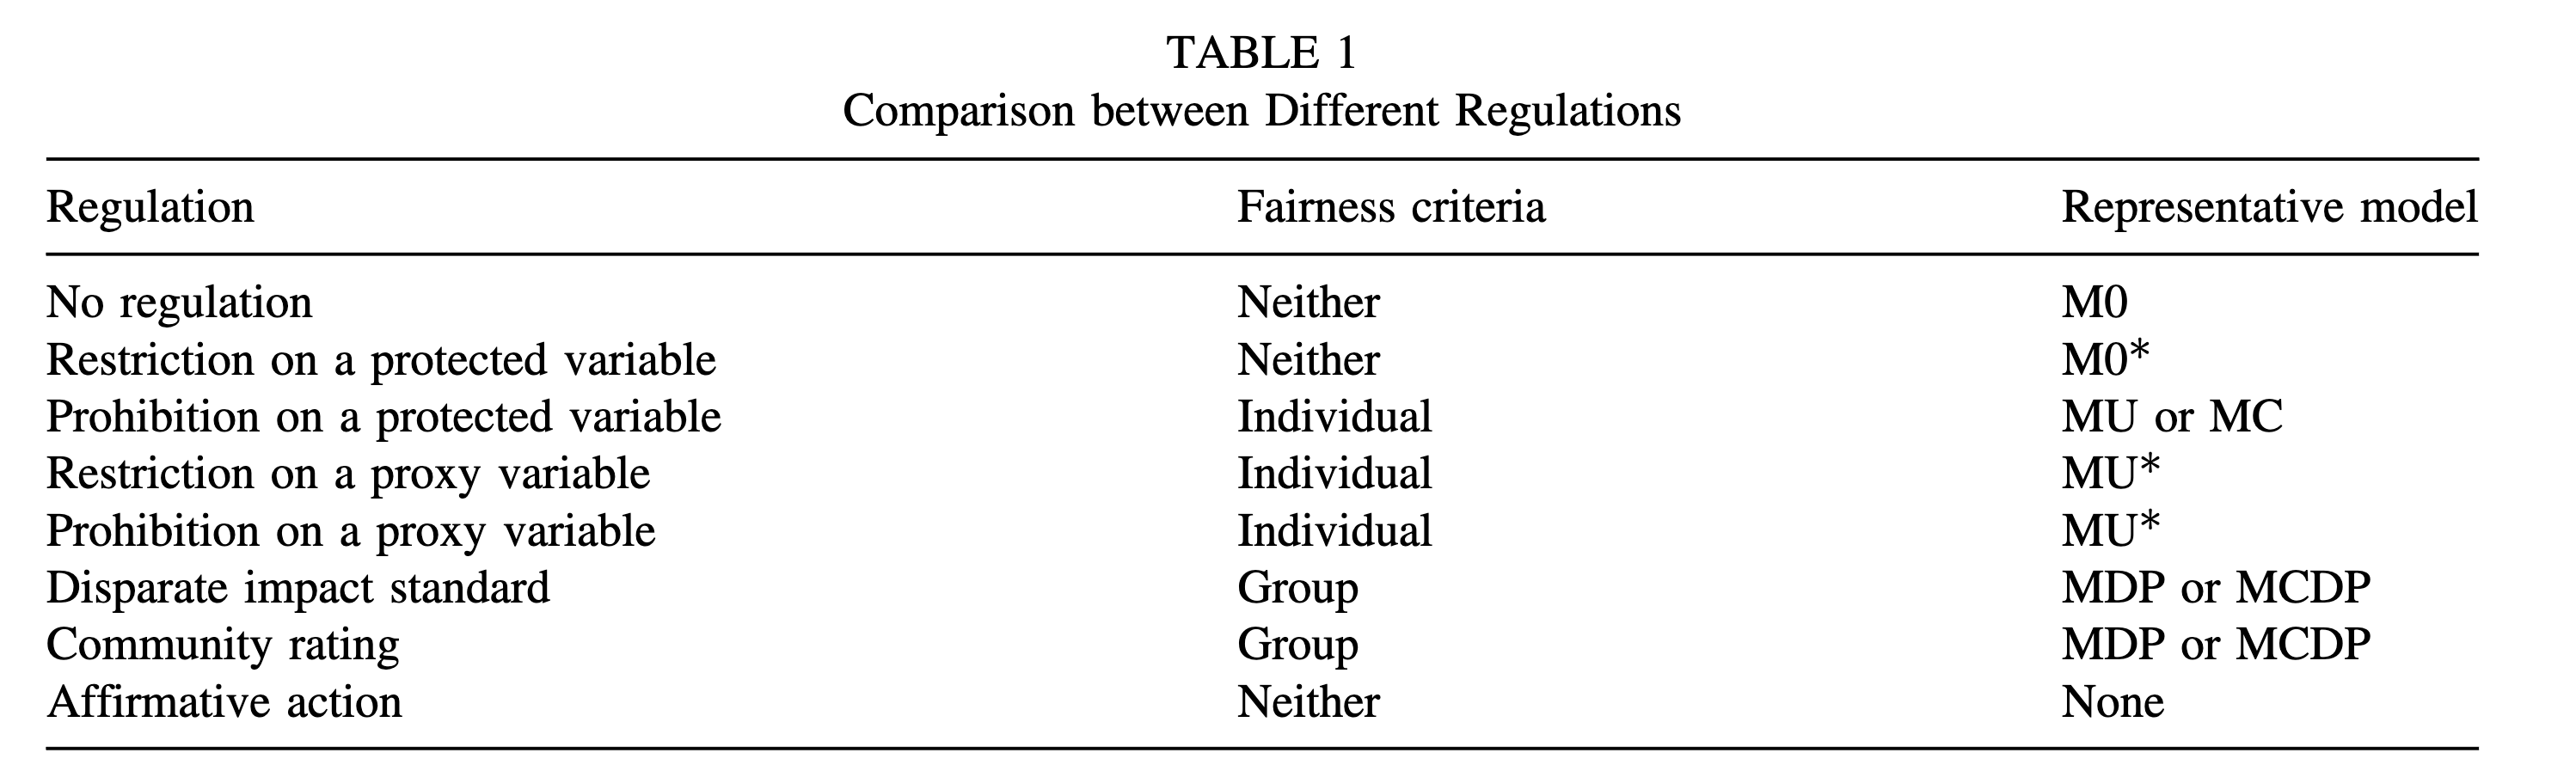
Mapping between regulations, fairness criteria, and model designs. Source: Xin and Huang (2024).
Regime → criterion → model design → explainability verifies → privacy protects the pipeline.
Part 4 — Practical governance
Model documentation (Model Card)
A model card is a short, standard document summarising a model for anyone auditing, inheriting, or approving it.
Purpose · Data · Fairness criterion · Performance · Fairness audit · Explainability summaries · Privacy assessment · Limitations · Owner and reviewer
Documentation is what makes a governance claim checkable, not just asserted.
Six governance practices
Source: National AI Centre AI6 guidance (National AI Centre 2025)
- Accountability. A named owner, including for vendor systems
- Impact assessment. Who could be harmed, especially vulnerable groups
- Risk management. Context-specific, since the same model can carry different risk depending on deployment
- Transparency. A register of every AI system in use
- Test & monitor. Before deployment, and continuously after
- Human control. Real intervention points, not rubber-stamping
Important
Vendor accountability doesn’t transfer. The regulator looks to the deploying organisation (Ch 1’s ASIC REP 798).
AI6 practices, applied to claims triage
Each practice, grounded in a real regulatory anchor, applied to this chapter’s own claims-triage system (see the capstone case study):
| Practice | Regulatory anchor | Applied here |
|---|---|---|
| 1. Accountability | FAR; ASIC REP 798; APRA CPS 230 | Who owns the decision to reject a claim: the vendor, the assessor, or the insurer? |
| 2. Impact assessment | Anti-discrimination law; Privacy Act ADM (Dec 2026) | Could the triage score systematically disadvantage claimants least able to absorb a delay? |
| 3. Risk management | APRA CPS 230 | Same model, different risk: a delayed motor claim vs. a delayed hardship claim |
| 4. Transparency | Privacy Act ADM (Dec 2026); ASIC’s 11 questions | Can a claimant be told, today, why their payment was delayed? |
| 5. Test & monitor | APRA CPS 230 model risk | Does the model stay calibrated as fraud patterns shift? |
| 6. Human control | FAR “reasonable steps”; APRA CPS 230 continuity | Does the reviewing assessor have real authority to override the flag? |
Governance is a culture, not a checklist
| Function | Responsibility |
|---|---|
| Risk & compliance | Own the framework, set risk appetite (how much risk the org accepts) |
| Technology & data | Build it into the pipeline, monitor continuously |
| Frontline users | Real oversight, knowing when and how to override |
Tools only produce a trustworthy system inside an organisation that assigns ownership and gives people real authority to intervene.
Choosing the right tool
| Task | Tool |
|---|---|
| Which variables drive predictions | PFI, grouped SHAP |
| Shape of a variable’s effect | PDP, ALE |
| Explain one prediction | SHAP waterfall |
| Detect interactions | H-statistic, SHAP interaction values |
| Enforce demographic parity | MDP, MCDP |
| Audit for compliance | TOST + HC3 |
| Assess re-identification risk | sdcMicro |
| Share data externally | Synthetic data + NNDR |
Part 5 — Course summary
What we set out to do
Responsible AI = making innovation defensible.
- Does the model treat people equitably? (Fairness)
- Can decisions be understood and justified? (Explainability)
- Are personal data used appropriately? (Privacy)
What this course cannot do
- Criteria are contested. Which one applies is social/political, not statistical
- Methods have assumptions. Know them before you trust the output
- Regulation is evolving. Much of what we covered was written in the last 3 years
- Interaction effects are hard to anticipate. Fair + explainable + private in isolation ≠ safe combined
- This course focused on structured-data models. Generative AI shares the principles, adds new failure modes (Chapters 2, 4, 6’s LLM sections touched on this)
💬 Discuss (5 min) — wrap-up
Of those five limitations —
which worries you most, for a system you might build or evaluate after this course?
The integrated view
Not a checklist completed once before deployment. A continuous process across the full lifecycle, from problem formulation to retirement.
The practitioner’s responsibility
“The actuarial profession should lead, not follow, in building public trust in AI systems.” — Huang (2025)
The same position (quantitative fluency, accountability for a certified model, a bridge between technical and non-technical stakeholders) applies to credit risk analysts, HR analytics leads, and clinical decision-support leads alike.
Recommended reading
Thank you
Questions, feedback, and continued conversation welcome. This is the end of the syllabus, not the end of the questions.