Trade-offs, Integration, and Governance
Quantitative Responsible AI: Principles, Governance, and Methods
Learning objectives
By the end of this chapter, you are expected to be able to:
- Summarise and connect the quantitative methods covered across Chapters 2–7.
- Identify and analyse the key trade-offs among fairness, explainability, and privacy.
- Apply the ethical AI lifecycle as an integrating framework for responsible AI projects.
- Design a governance and documentation workflow appropriate for any consequential AI system.
- Critically evaluate an AI-based decision system, in insurance or another high-stakes domain, against the six principles of AI ethics.
Review: What We Have Covered
Three pillars, six chapters
This course introduced responsible AI through three interlocking pillars, each examined first at the level of general principles and then through quantitative methods worked through on real insurance data as a consistent case study.
| Chapter | Pillar | Key methods and concepts |
|---|---|---|
| 2 | Fairness (Principles) | Fairness criteria (FTU, CPV, DP, CDP, Separation, Sufficiency); five model designs (M0, MU, MDP, MCDP, MC); welfare analysis and audit framework (brief overview) |
| 3 | Fairness (Practice) | Fitting M0/MU/MDP/MCDP/MC in R, fairness–accuracy trade-off, premium redistribution, and binary classification case study (COMPAS, a US recidivism-risk tool) with fairness and fairmodels |
| 4 | Explainability (Principles) | Taxonomy of interpretability; PFI, PDP, ALE, SHAP, LIME; regulatory expectations; communication |
| 5 | Explainability (Practice) | XGBoost pricing model, feature importance, PDP and ALE for Age and Bonus, global and local SHAP, H-statistic, and SHAP interaction values |
| 6 | Privacy (Principles) | Re-identification risk; k-anonymity, l-diversity, t-closeness; differential privacy; synthetic data; regulatory landscape |
| 7 | Privacy (Practice) | Re-identification risk assessment, applying k-anonymity with sdcMicro, Laplace mechanism, synthetic data with synthpop, and fidelity and privacy evaluation |
Fairness (Ch 2–3). FTU is fairness through unawareness, dropping the protected attribute from the model. CPV is controlling for the protected variable, averaging predictions over it at scoring time. DP here means demographic parity, equal outcomes across groups. This is a different DP from differential privacy, which shows up later in this chapter’s privacy section, so watch for which one is meant each time. CDP is conditional demographic parity, equal outcomes within legitimate segments. M0, MU, MDP, MCDP, and MC are the five model designs that enforce these criteria, running from the unconstrained baseline (M0) to full parity (MDP).
Explainability (Ch 4–5). PFI is permutation feature importance. PDP is a partial dependence plot, showing a feature’s average effect on predictions. ALE is accumulated local effects, a version of PDP that copes better with correlated features. SHAP assigns each feature a contribution to one prediction. LIME is a similar local, model-agnostic method. The H-statistic measures how strongly two features interact.
Privacy (Ch 6–7). k-Anonymity, l-diversity, and t-closeness are dataset-level privacy guarantees, each patching a weakness in the one before it. Differential privacy adds calibrated noise so no single record can be identified from the output, with the parameter epsilon (\varepsilon) controlling how much noise is added.
Connecting back to the six AI ethics principles
Each pillar addresses a distinct cluster of the six AI ethics principles introduced in Chapter 1.
| Principle | Where addressed |
|---|---|
| Fairness and non-discrimination | Chapters 2–3: criteria, model design, audit |
| Transparency and explainability | Chapters 4–5: PDP, SHAP, local explanations |
| Accountability | Chapters 2, 4, 8: governance, documentation, pre-commitment |
| Privacy and data ethics | Chapters 6–7: k-anonymity, differential privacy, synthetic data |
| Contestability | Chapter 4: right to explanation, Chapter 5: counterfactual explanations |
| Stability and robustness | Chapter 8: monitoring, drift, systemic risk |
No single chapter is self-contained. A real AI system, in insurance or any other high-stakes domain, must address all six principles simultaneously, and managing the interactions among them is the subject of this chapter.
Revisiting the motivating problem
Since the early 1990s, US car insurers have priced policies partly on credit-based insurance scores, statistical scores derived from a consumer’s credit history, on the grounds that the scores are genuinely predictive of who will file claims. This is actuarial fairness in its purest form. It charges people according to their true expected cost. Despite that predictive validity, the practice triggered unusually sustained regulatory pushback, investigations in at least 17 US states, five congressional hearings, and dozens of state laws restricting its use (Kiviat 2019).
Regulators did not object that the scores failed to predict. Most agreed they did. Their objection was that prediction alone did not settle who deserved to pay more. They pushed insurers to explain why credit scores predicted claims, and used that reasoning to separate genuine irresponsibility (broadly accepted as fairly priced) from misfortune such as divorce, job loss, or a medical emergency (which most states now require insurers to disregard, via “extraordinary life circumstances” exemptions written into law). A 2007 FTC report added a distributional dimension. More than a quarter of African American consumers fell in the lowest score decile, versus 3 percent of white consumers. The scores still predicted claims within each group, satisfying actuarial fairness on its own terms.
The regulatory outcome reflects this contested middle ground rather than a clean resolution. Four US states (Hawaii, California, Massachusetts, and Maryland) ban the use of credit-based insurance scores outright. Every other state instead imposes constraints, such as the extraordinary life circumstances exemptions above, mandatory disclosure to consumers, or restrictions on which credit factors may be used, while still permitting the underlying practice.
The case shows that a criterion can be statistically valid and satisfy a named, recognised fairness definition, and still be rejected as illegitimate, because which fairness criterion should govern a practice is itself a contested, political determination, not a purely quantitative one. We can now answer that same question rigorously for our own course’s worked example: a motor insurer that removed gender from its pricing model but retained engine size and annual mileage, both of which correlate with gender in the data. This structure, a protected attribute removed with its influence persisting through correlated features, recurs in hiring, lending, and healthcare models alike. We asked one question. Has the insurer achieved fairness?
By now, you have the tools to answer this rigorously:
- Chapter 2: Is the model FTU-fair? Possibly. Is it DP- or CDP-fair? Likely not. Removing X_P as an input does not guarantee \hat{Y} \perp X_P.
- Chapter 3: Fit MCDP or MC to debias the output. Quantify the remaining disparity with a pre-committed TOST audit (equivalence testing, which shows compliance rather than just failing to detect a violation).
- Chapter 4: Use PDP and SHAP to explore which variables may be contributing to the observed gender disparity.
- Chapter 5: Examine SHAP interaction values. Does Bonus (the driver’s bonus-malus, or no-claims discount, level) interact with the proxies in ways that amplify the gender effect?
- Chapter 6: If the model uses telematics (driving data collected from an in-car device or app) or third-party data, what re-identification risks arise? Is the data minimisation principle satisfied?
- Chapter 7: Could differential privacy or synthetic data be used in the model development pipeline to reduce individual-level exposure?
This is what an integrated responsible AI analysis looks like in practice.
The Key Trade-offs
Three fundamental tensions
The three pillars of this course are not independent. Each creates obligations that can conflict with the others. Navigating these tensions is a core professional skill.
1. Fairness vs accuracy Imposing a fairness constraint (e.g. demographic parity) reduces the model’s ability to use all available predictive information. The constrained model will typically have a higher loss, and a higher risk of adverse selection (higher-risk customers being more likely to buy or stay, since they know their own risk better than the insurer does).
2. Explainability vs performance Simpler, more interpretable models (GLMs, decision trees) are easier to explain but generally less accurate than complex ensemble methods. Conversely, SHAP and other post-hoc explanation tools make complex models more interpretable, but at the cost of additional computation and potential approximation error.
3. Privacy vs utility Privacy-enhancing techniques reduce the information content of data. k-Anonymity generalises or suppresses records, differential privacy adds noise, and synthetic data introduces distributional distortion. All three reduce the statistical utility available for modelling.
The fairness–accuracy trade-off
The empirical evidence from Xin and Huang (2024) on French motor insurance data provides a useful reference point. The same qualitative pattern (modest accuracy loss for substantial fairness gain) recurs in fair-ML studies in other domains.
| Model | RMSE (accuracy) | Mean gender premium ratio |
|---|---|---|
| M0 (unconstrained) | Lowest | Highest disparity |
| MU (unawareness) | Slight increase | Moderate reduction |
| MCDP | Modest increase | Large reduction |
| MC | Modest increase | Large reduction |
| MDP (full parity) | Largest increase | Near zero disparity |
RMSE (accuracy) measures how far predicted premiums deviate from actual claims cost, smaller is better. Mean gender premium ratio compares the average premium charged to women against men, closer to one means less disparity.
Key finding. The cost of fairness is smaller than often assumed, but it is not zero. MCDP and MC achieve large reductions in gender disparity with only modest losses in predictive accuracy. MDP achieves demographic parity but at a meaningful accuracy cost.
This trade-off is not universal, however. When the unconstrained model’s errors are themselves unevenly distributed across groups, for example if it systematically under- or over-predicts for one group more than another, a fairness-aware model can reduce that error disparity while simultaneously improving overall accuracy, a genuine win-win rather than a trade-off. Huang et al. (2024) demonstrate this in annuity pricing: their fairness-regularised factor model reduced decision-error disparity across demographic groups while also improving predictive accuracy relative to the unconstrained benchmark, using Australian mortality data. Whether a given problem admits this kind of win-win, or forces a genuine trade-off, is an empirical question, not something to assume either way in advance.
There is no statistically correct level of fairness constraint. The appropriate trade-off depends on:
- The regulatory regime (what is required vs what is permitted)
- The product type (social good vs economic commodity)
- Stakeholder values (how much adverse selection risk is acceptable)
- Market structure (what competitors are doing)
Practitioners (actuaries, credit risk analysts, HR analytics leads, or their equivalents) should quantify the trade-off and present it to decision-makers, not choose it themselves.
The privacy–utility trade-off
The case study in Chapter 7 illustrated how privacy protection reduces statistical utility.
| Technique | Privacy guarantee | Utility cost |
|---|---|---|
| k-Anonymity (k=50) | No formal guarantee | Generalisation reduces variable precision, and some records are suppressed |
| Differential privacy (\varepsilon = 1) | Strong (\varepsilon-DP) | High noise, statistics may be unreliable |
| Differential privacy (\varepsilon = 10) | Weak | Low noise, statistics close to true values |
| Synthetic data (no DP) | No formal guarantee | High fidelity possible, memorisation risk for rare records |
| Synthetic data (DP-trained) | Formal guarantee | Lower fidelity than non-DP synthesis |
The right choice depends on the purpose of the data release, the sensitivity of the individuals involved, and the regulatory context.
It might seem like more protection is always better, so why not apply several techniques together, k-anonymising, then synthesising, then adding differential privacy on top? Chapter 7’s case study argues against this by example, not by assertion. Three recipients requesting the same insurance dataset needed three different, single techniques. A reinsurer building its own pricing model got synthetic data (CART-based, via synthpop), validated by a train-synthetic-test-real check showing negligible loss of predictive accuracy. An internal team already inside the organisation got governance and access control alone. A vendor who only ever needed aggregate statistics, never a record-level file, got differential privacy. Stacking all three onto the vendor’s request would mean degrading a file they never asked for in the first place.
The right question is not “which combination of techniques is strongest” but “what does this specific recipient actually need, and what is the cheapest technique that supplies it without compromising anyone’s privacy.” Defence-in-depth still applies, but across the stages of the data lifecycle discussed below, collection, storage, analytics, sharing, retention, not by piling multiple privacy-enhancing techniques onto a single release.
The explainability–fairness interaction
Explainability tools are not neutral. They can reveal fairness problems or mask them.
Revealing: A SHAP beeswarm plot that shows Postcode as a dominant driver of premium variation (premium being the price a customer pays for their policy) does not by itself establish that Postcode is acting as a proxy for a protected attribute or contributing to a fairness problem. But it can prompt exactly the kind of further investigation, into whether Postcode is standing in for a protected attribute, that a fairness audit alone might not have flagged.
Masking: Slack et al. (2020) demonstrated that SHAP and LIME can be manipulated. A model can be designed to produce innocuous-looking SHAP values for a fairness auditor while still discriminating in production. This is why explanation methods must be used alongside, not instead of, formal fairness testing.
Xin et al. (2025) show the same vulnerability extends to PDP, the default sanity check for a protected or proxy variable in the regulatory checklist below. Their adversarial construction leaves a black-box model’s real-world predictions almost untouched, changing behaviour only in the sparse, rarely-observed region of the input space that PDP’s averaging step depends on, while the resulting plot for the manipulated variable is engineered to look flat and non-discriminatory. Validated on real insurance and COMPAS data, the finding targets exactly the regulatory evidence practice referenced below. A flat PD plot is not, by itself, proof of fairness.
The right workflow uses explainability tools to:
- Generate hypotheses about which variables may be driving unfair disparities
- Help diagnose and communicate fairness-audit findings once a criterion and model design have been chosen through the regulatory context, decision purpose, and normative judgement discussed in Chapter 2, not to select the criterion itself
- Communicate audit results to non-technical stakeholders
- Provide individual-level explanations to policyholders who request them
An Integrated Framework
Returning to the ethical AI lifecycle
Chapter 1 introduced the ethical AI lifecycle as a six-stage framework. Having covered the quantitative tools for each pillar, we can now populate each stage with specific responsible AI obligations.
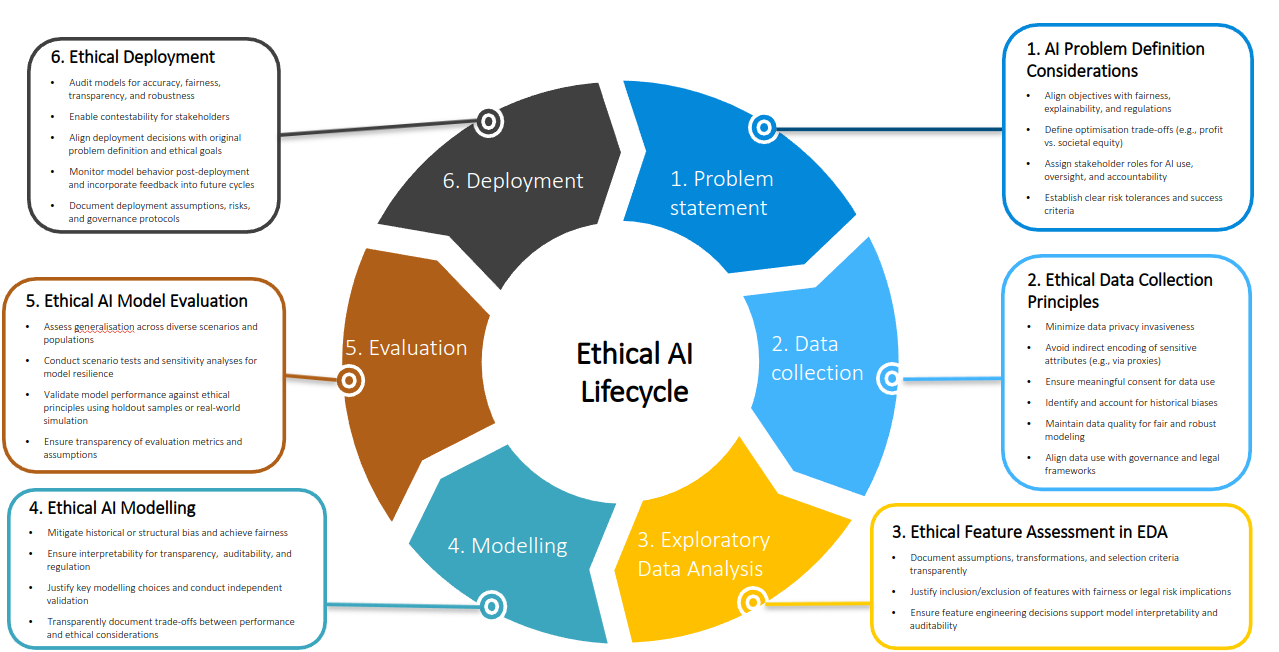
Stage 1: Problem definition
Key question: whose problem is being solved, and could the solution harm anyone?
Responsible AI checklist for this stage:
This stage sets the frame for every subsequent decision. A wrong choice here (using the wrong outcome variable, optimising for the wrong objective, failing to identify affected groups) cannot be corrected by better modelling later. Chapter 1’s UK exam-grading algorithm is a canonical failure at exactly this stage. Letting each school’s historical grade distribution determine individual students’ results was a problem-definition choice, not a modelling one, and no amount of careful downstream work could fix it once made.
Stage 2: Data collection
Key question: is the data appropriate, consented, and free of historical bias?
Responsible AI checklist for this stage:
Chapter 6’s GM OnStar case is a Stage 2 failure at exactly this point. Customers consented to trip-level driving data for a driving-feedback programme, not for it to be sold to a data broker who resold it to insurers for pricing. Purpose limitation failed at scale, not because the data itself was mishandled, but because the stated purpose at collection time did not match its eventual use.
Stage 3: Model development
Key question: does the model enforce the chosen fairness criterion and remain explainable?
Responsible AI checklist for this stage:
Stage 4: Model validation
Key question: can we demonstrate that the model meets its fairness, explainability, and privacy obligations?
Responsible AI checklist for this stage:
Stage 5: Deployment
Key question: are governance, oversight, and contestability mechanisms in place?
Responsible AI checklist for this stage:
Stage 6: Monitoring
Key question: does the model remain fair, explainable, and privacy-preserving as data and populations change?
Responsible AI checklist for this stage:
Capstone case study: applying the full lifecycle
The six stages above are easier to internalise against one running example than as six separate checklists. Consider a motor insurer building an AI-driven claims-triage system. Every incoming claim receives a fraud-risk and complexity score, low-scoring claims are fast-tracked for payout within 48 hours, and high-scoring claims are routed to a specialist investigation team for manual review before any payment is made.
This single system creates a genuine tension in each of the three pillars, not a hypothetical one:
- Fairness. If the fraud-risk score correlates with postcode, vehicle type, or claim history in ways that route certain groups to slower manual review more often, the claimants least able to absorb a cash-flow delay after an accident are also the ones most likely to face one.
- Explainability. A claimant whose payment is delayed, or whose claim is denied, generally has a right to know why, particularly when the flag comes from an opaque ensemble model, and the investigation team needs to trust a flag before acting on it.
- Privacy. The model may draw on claim narrative text, injury or medical detail, prior claim history, and third-party records (police reports, repair-shop invoices), data that a fraud model needs to be accurate, and that a data-sharing agreement with an external investigator or reinsurer needs to protect.
For each stage below, answer the applied question using the specific tools and criteria from the chapter indicated, not general reasoning alone.
| Stage | Applied question | Chapter(s) |
|---|---|---|
| 1. Problem definition | What is the cost of a false positive (a genuine claim delayed) versus a false negative (a fraudulent claim paid), and who bears each cost? Is this decision reversible? | 1 |
| 2. Data collection | Does the claim-history data reflect any past pattern of over-investigating particular groups? Is the claim narrative text, which may contain health or demographic detail, minimised to what the fraud model actually needs? | 6 |
| 3. Model development | Which fairness criterion applies (equalised investigation rates? equalised false-positive rates?), and which model design enforces it without destroying the fraud-detection signal? | 2, 3 |
| 4. Model validation | What pre-committed audit protocol would demonstrate, rather than merely fail to contradict, that investigation rates do not disproportionately fall on any group? | 2, 3 |
| 5. Deployment | What does a claimant see when their payment is delayed? A specific, actionable explanation and a real appeals channel, or only a generic notice? | 4, 5 |
| 6. Monitoring | Fraud patterns shift after major events (e.g. a hailstorm generating a spike in genuine claims that could look like a fraud cluster to a static model). What triggers re-validation? | 3, 6 |
Then step back from the stage-by-stage view and address the trade-offs directly:
- Does a stricter fraud model that catches more real fraud, protecting honest policyholders from the higher premiums fraud eventually causes, justify a higher false-positive rate that delays more genuine claimants? Who should make that call, and using what evidence?
- Does minimising the claim data collected for privacy reasons remove exactly the free-text and behavioural detail that makes the fraud model accurate? Is there a technique from Chapter 6 or 7 that reduces this cost rather than simply accepting it?
- Is a more accurate but less explainable model, or a less accurate but more transparent one, the right choice here, given that the explanation is owed directly to an individual claimant, not only to a regulator?
There is no single answer key for this exercise. What you should have by the end is a defensible, evidenced position on each question, and an honest account of which trade-offs you resolved versus which you only acknowledged.
Sample answers
Attempt the exercise yourself before reading these. They illustrate one defensible line of reasoning per question, grounded in tools from the chapter indicated, not the only correct one.
Click to reveal sample answers
1. Problem definition. A false positive (a genuine claim delayed) falls directly on an already-distressed policyholder, who may face real hardship while under investigation. A false negative (a fraudulent claim paid) falls diffusely on the wider pool of honest policyholders, through higher future premiums. The costs differ in size, timing, and who bears them, so this is a distributional question, not a symmetric accuracy one. The flagging decision is reversible in the sense that a wrongly-flagged claim can eventually be paid, but the delay and any resulting hardship are not undone by a later correction.
2. Data collection. If past investigation decisions were themselves shaped by human bias (for example, investigators disproportionately scrutinising certain postcodes), a model trained on that history will encode and automate the same pattern, exactly Stage 2’s question about historical discrimination. On minimisation, claim narrative text usually contains far more than the fraud signal requires. A defensible design extracts only the specific structured features the model needs (timeline inconsistencies, damage-severity mismatches) rather than feeding the full free text into the model, the data minimisation principle from Chapter 6.
3. Model development. Equalised investigation rates (demographic parity on who gets flagged) is the wrong criterion, since it would force flagging genuinely fraud-prone patterns evenly regardless of actual risk. Equalised false-positive rates, a form of separation (Chapter 2), fits better: it does not require flagging genuine claimants at the same rate across groups, only that innocent claimants are not more likely to be wrongly flagged in one group than another. An MCDP-style design (Chapters 2-3), debiasing only the specific proxy variables driving the disparity, enforces this at a smaller accuracy cost than full demographic parity.
4. Model validation. A pre-registered TOST equivalence test (Chapters 2-3), comparing false-positive investigation rates across groups against a pre-specified tolerance band, provides positive evidence of compliance, rather than the weaker claim that a plain significance test simply failed to detect a difference.
5. Deployment. A claimant should receive a reason specific to their own claim (for example, “the reported repair cost is significantly higher than typical for this type of damage”), generated with a local explanation method such as SHAP (Chapters 4-5), plus a genuine appeals channel with a human reviewer empowered to override the flag, not only a generic “under review” notice and a rubber-stamp process.
6. Monitoring. A monitored spike in the flag rate for a specific geography or claim type, relative to the model’s training-period baseline, should trigger a review of whether the shift reflects genuine new fraud patterns or a legitimate surge in real claims (for example, after a hailstorm) that the model is misreading as suspicious.
Trade-off 1. This is a policy decision, not a modelling one, the point made earlier in this chapter. The model owner should quantify the trade-off, the measured cost in delayed genuine claims against the measured benefit in caught fraud, and present it to a decision-maker accountable for the choice, rather than resolve it unilaterally.
Trade-off 2. Potentially yes, if minimisation means dropping the free-text narrative outright. But Chapter 7’s techniques offer a middle path: generalising the more identifying fields while retaining a derived, less-identifying feature (for example, a timeline-inconsistency score computed once, with the raw narrative then discarded) can preserve the specific signal without retaining the full sensitive record.
Trade-off 3. Because the explanation obligation runs to an individual claimant, not only to a regulator, Chapter 4’s SHAP-versus-LIME discussion is directly relevant: a gradient-boosted model paired with TreeSHAP local explanations can deliver both strong fraud detection and a genuine per-claimant explanation. A simpler scorecard model trades away detection accuracy for an explanation-simplicity gain that SHAP already mostly closes, so the stronger case here is for the more accurate model with rigorous local explanations, not the simpler model by default.
Regulations, criteria, and models: a unified view
The mapping between regulatory regimes, fairness criteria, and model designs, introduced in Chapter 2, provides a useful anchor for the integrated framework.
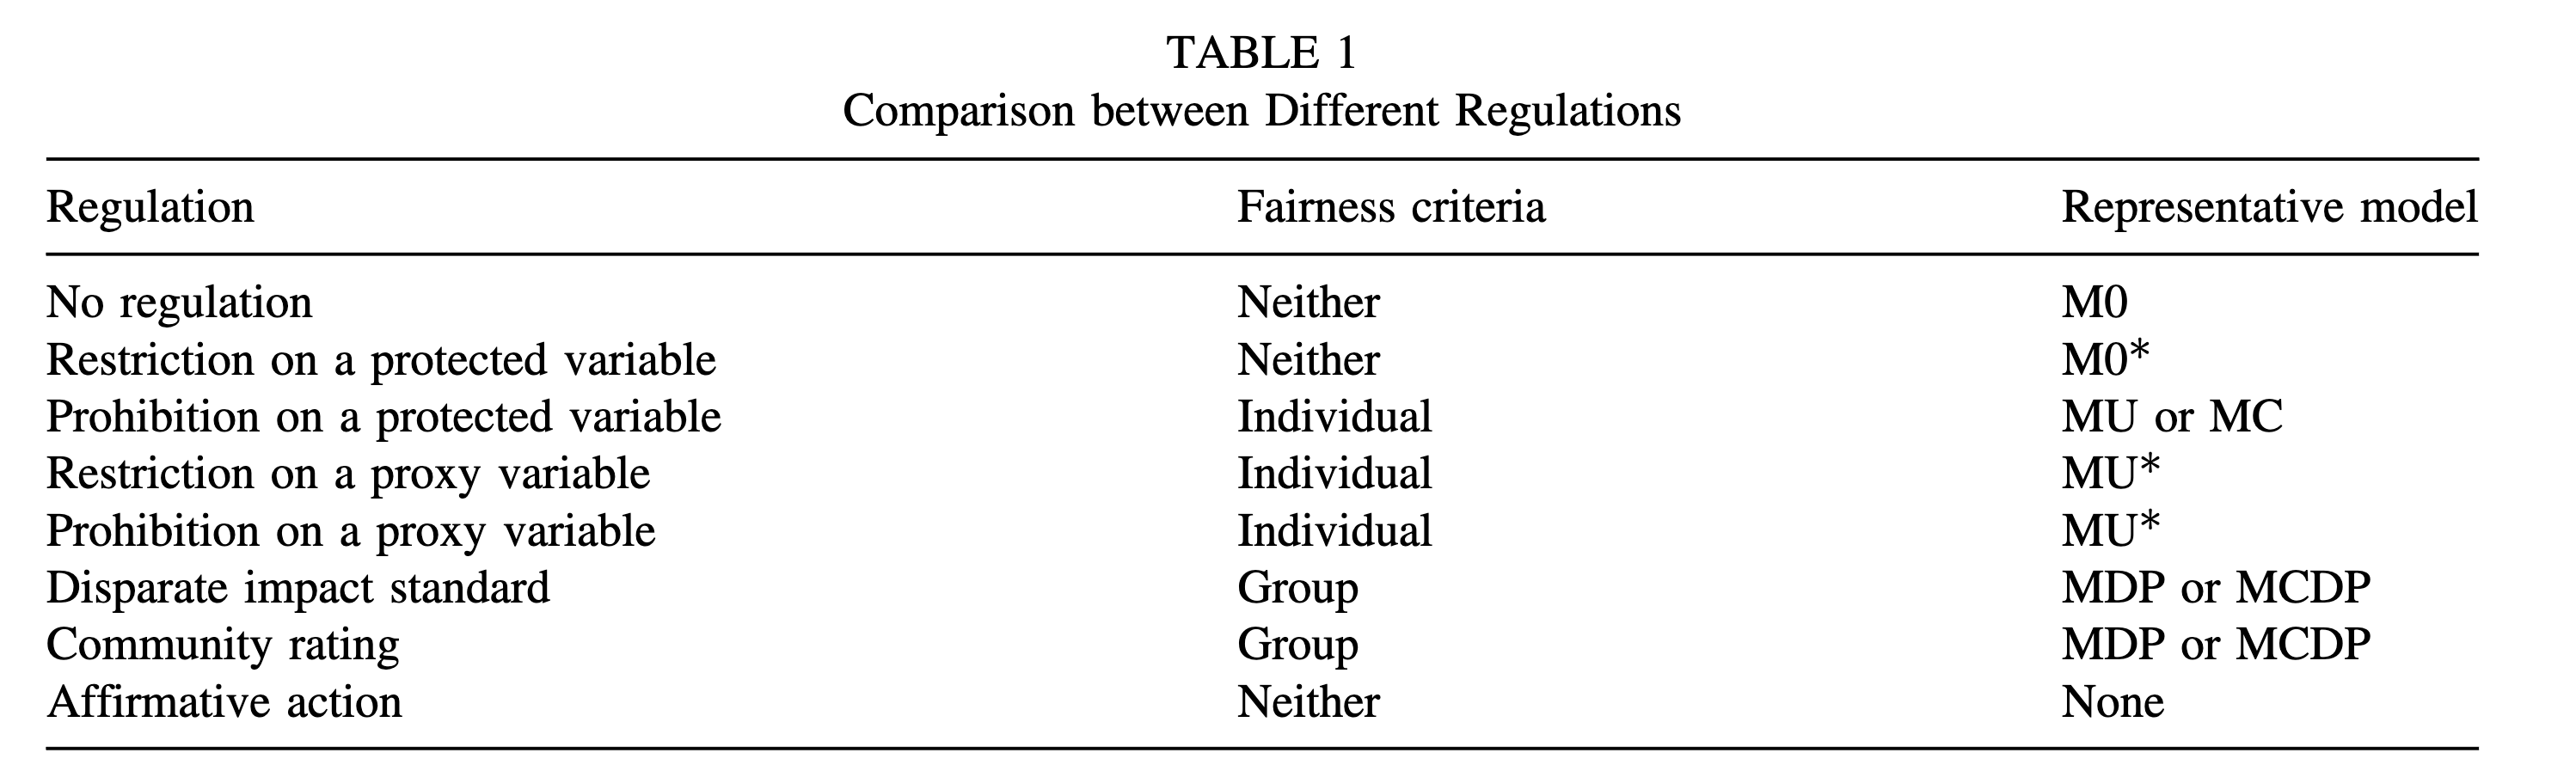
Reading this diagram from left to right describes the full decision chain:
- Regulatory regime determines which fairness obligations apply
- Fairness criterion translates obligations into a measurable condition
- Model design enforces the criterion in the pricing model
- Explainability tools help diagnose and communicate whether the model behaves as the criterion intends, alongside, not instead of, the formal fairness testing that actually verifies it
- Privacy techniques protect individuals whose data was used in development
Practical Governance
What governance artefacts are needed?
Responsible AI is not only a technical discipline. It requires documentation that supports oversight, accountability, and continuous improvement.
Model documentation (Model Card)
A model card is a short, standard document summarising a model for anyone auditing, inheriting, or approving it.
| Element | Content |
|---|---|
| Purpose | What the model is used for, and its scope and intended users |
| Data | Training data sources, period, preprocessing steps |
| Fairness criterion | Which criterion was chosen and why, and its regulatory basis |
| Performance | Accuracy metrics on training, validation, and test sets |
| Fairness audit | Audit protocol, results, confidence intervals, TOST outcome |
| Explainability | Key SHAP summaries, PDP for main input features (e.g. rating factors in insurance) |
| Privacy | Re-identification risk assessment, techniques applied |
| Limitations | Known failure modes, out-of-scope use cases |
| Owner and reviewer | Named responsible parties, review schedule |
Six organisational governance practices
Model documentation operationalises governance for a single model. A complete governance programme also needs organisation-wide practices spanning every system a team deploys. Australia’s National AI Centre AI6 guidance is a useful worked example. The six practices generalise well beyond any one jurisdiction.
| Practice | What it means | Connects to |
|---|---|---|
| 1. Accountability | A named owner for every AI system across its lifecycle, including third-party/vendor systems | Stage 1, Model Card owner field |
| 2. Impact assessment | Assess who could be harmed, with particular attention to vulnerable groups, and build contestability channels | Chapters 2–3 welfare analysis, contestability principle |
| 3. Risk management | Context-specific controls, since the same model can be low- or high-risk depending on where it is deployed | Stages 1–3 checklists |
| 4. Transparency | Maintain a register of all AI systems in use, disclose AI use, and know what vendors built and on what data | Chapters 4–5 explainability |
| 5. Test & monitor | Test before deployment, monitor continuously after, and independent audit for high-risk systems | Chapter 2’s audit protocol, Stage 6 monitoring |
| 6. Human control | Meaningful oversight with real intervention points (pause, override, roll back), not rubber-stamping | Contestability principle, Stage 5 deployment |
Source: National AI Centre, Guidance for AI Adoption (Oct 2025) (National AI Centre 2025).
Outsourcing an AI system to a third party does not outsource the regulatory obligations that come with using it. If a vendor model produces unfair outcomes or breaches a licence condition, the regulator looks to the deploying organisation. The question is whether it governed the vendor adequately (see Chapter 1’s ASIC REP 798 example).
Chapter 6’s WeBank case study is a useful counterpart to the ASIC example above. WeBank built federated learning into its credit-rating model from the start, via its open-source FATE framework, letting the model train across institutions without any of them centralising the others’ raw data. Privacy by design, in the GDPR Article 25 sense (Chapter 6), is a governance choice made at Stage 3 (model development), not a control retrofitted at Stage 5 (deployment). The direct insurance analogue, several insurers jointly training a shared fraud-detection model without pooling claims data, remains at the research and pilot stage, which is itself a governance lesson. The technique exists, but institutional coordination has not caught up with it.
Governance is a culture, not a checklist
A checklist gets signed off once. A culture is lived continuously, and it is the foundation every practice above rests on. Responsibility spans the whole organisation, not just a compliance function:
| Function | Responsibility |
|---|---|
| Risk and compliance | Own the governance framework, set risk appetite (how much risk the organisation is willing to accept), and escalate when governance lags adoption |
| Technology and data | Build ethical principles into the pipeline, maintain the AI register, test and monitor throughout the lifecycle, and design fallback processes |
| Business lines and frontline users | Understand the tools they use daily, exercise genuine oversight, know when and how to override, and raise concerns rather than accept outputs |
Fairness criteria, explanation tools, and privacy techniques are necessary, but they only produce a trustworthy system inside an organisation that has assigned ownership, resourced monitoring, and given people real authority to intervene.
Choosing the right technique for the task
A practical summary of when to reach for each tool introduced in this course.
| Task | Recommended tool | Chapter |
|---|---|---|
| Identify which variables drive predictions | Permutation feature importance, grouped SHAP | 4, 5 |
| Understand the shape of a variable’s effect | PDP, ALE | 4, 5 |
| Explain an individual prediction | SHAP waterfall, LIME, local what-if analysis | 4, 5 |
| Detect and quantify interaction effects | H-statistic, SHAP interaction values | 5 |
| Enforce demographic parity | MDP, MCDP | 2, 3 |
| Audit for compliance | TOST with HC3 standard errors | 2, 3 |
| Assess re-identification risk | sdcMicro, quasi-identifier analysis |
6, 7 |
| Anonymise tabular data | k-Anonymity via sdcMicro |
6, 7 |
| Release privacy-protected statistics | Laplace mechanism (differential privacy) | 6, 7 |
| Share data for external use | Synthetic data via synthpop + NNDR evaluation |
6, 7 |
The practitioner’s responsibility
“The actuarial profession should lead, not follow, in building public trust in AI systems.”
— Huang (2025)
Actuaries occupy a distinctive position in the responsible AI landscape:
- They are trained in the quantitative methods needed to implement fairness criteria, explanation tools, and privacy techniques
- They hold professional accountability for the models they certify
- They communicate with both technical teams (developers, data scientists) and non-technical stakeholders (boards, regulators, customers)
- They are subject to professional standards that require them to consider the public interest, not only the interests of their employer
The same position (quantitative fluency, accountability for a certified model, and a bridging role between technical and non-technical stakeholders) is held by credit risk analysts in lending, HR analytics leads in hiring, and clinical decision-support leads in healthcare. Responsible AI is therefore not an external obligation imposed on any one profession. It is an extension of the core professional values that quantitative, decision-facing professions have always held.
Course Summary
What we set out to do
In Chapter 1, we defined responsible AI as the discipline of making AI innovation defensible, to regulators, stakeholders, and the people whose lives are affected by automated decisions.
We identified three core questions:
- Does the model treat people equitably? (Fairness)
- Can model decisions be understood and justified? (Explainability)
- Are personal data used appropriately and protected? (Privacy)
And we argued that answering these questions requires both principled frameworks and quantitative methods.
What the course delivered
Fairness (Chapters 2–3)
You can now define and distinguish six fairness criteria, implement five model designs that enforce those criteria, quantify the fairness–accuracy trade-off, and conduct a pre-committed compliance audit using equivalence testing.
Explainability (Chapters 4–5)
You can now apply permutation feature importance, PDP, ALE, and SHAP to a complex machine learning model, interpret global and local explanations, detect interaction effects, and communicate findings to technical and non-technical audiences.
Privacy (Chapters 6–7)
You can now assess re-identification risk in a tabular dataset, apply k-anonymity and differential privacy, generate and evaluate synthetic data, and select privacy-enhancing techniques appropriate to the data sharing context.
What this course cannot do
No course can fully prepare you for the complexity of responsible AI in practice. Several important limitations deserve acknowledgement.
Criteria are contested. Which fairness criterion is appropriate is ultimately a social and political decision, not a statistical one. Different stakeholders will reasonably disagree.
Methods have assumptions. SHAP values are exact for tree models but approximate for others. ALE assumes sufficient data density. Differential privacy assumes bounded sensitivity. Know the assumptions of the tools you use.
Regulation is evolving. The EU AI Act, Colorado SB21-169, the NY DFS Circular Letter, and NYC Local Law 144 (automated employment decision tools) were all introduced or substantially revised in the last three years. The regulatory landscape will continue to change, in insurance and elsewhere.
Interaction effects are hard to anticipate. A model that is fair, explainable, and privacy-preserving in isolation may still produce harmful outcomes when combined with other systems, data sources, or business processes.
This course focuses on structured-data predictive models. The fairness, explainability, and privacy methods covered apply to the models scoring, pricing, and screening decisions today. Generative AI systems (large language and image models) share the same underlying principles but add distinct failure modes (unauditable reasoning, hallucinated outputs, and silent behaviour changes from vendor updates) that warrant separate, related treatment.
The appropriate response to these limitations is not paralysis. It is professional humility, rigorous documentation, and a commitment to ongoing monitoring and review.
The integrated view
Responsible AI is not a checklist to be completed once before deployment. It is a continuous process embedded in the full lifecycle of an AI system, from the moment a problem is formulated to the moment a model is retired.
The tools in this course give you the quantitative vocabulary to participate meaningfully in that process. How you use that vocabulary (with professional judgement, ethical awareness, and a genuine commitment to the public interest) is up to you.
Recommended reading
- Huang (2025) — ethical AI lifecycle and professional obligations for actuaries
- Barocas and Selbst (2016) — foundational legal and technical treatment of disparate impact, general to any automated decision
- Xin and Huang (2024) — fairness criteria, model designs, and trade-offs, illustrated on insurance pricing
- Huang and Hooker (2026) — pre-committed audit protocol, illustrated on insurance pricing models
- Molnar (2025) — interpretable machine learning: comprehensive technical reference
- Dwork et al. (2006) — original differential privacy framework
- Slack et al. (2020) — adversarial attacks on SHAP and LIME, and the limits of explanation methods
- Xin et al. (2025) — adversarial manipulation of PD plots to conceal discrimination, validated on real insurance and COMPAS data
- Rudin (2019) — the case for inherently interpretable models in high-stakes decisions